2021 in Review: What Just Happened?
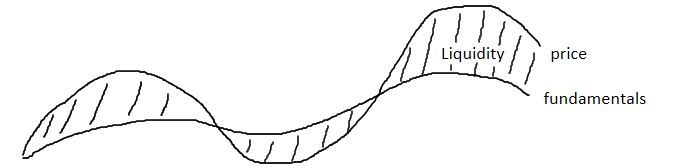
I believe it’s absolutely vital to think about asset prices the same way that Scott Grannis thinks about inflation, because ultimately they're the exact same phenomena: dollars chasing assets. Think of the situation in terms of supply and demand of each: the demand to deploy dollars relative to the supply of investable assets (maybe, it's more intuitive to think of it as supply of dollars vs supply of assets). Because every dollar is an undifferentiated commodity with no physical supply constraint in a particular market and the universe of any particular investable asset is inherently finite, you can have massive asset bubbles in the exact same manner you can have price inflation of anything else: too many dollars chasing too few goods. This is visualized below.

Because the supply of investable assets cannot rise swiftly to meet the influx of dollars, the imbalance mechanically devalues the dollars relative to the goods they're buying (the reciprocal way of saying that the assets' prices are rising). The market may not reflect this imbalance immediately due to hopium and the unviability of shorting something sustained by hopium. However, the disconnect between belief and reality cannot continue forever. Eventually reality catches up. At this point, the loss of purchasing power of the dollars in that market is actualized: i.e. the assets' prices drop viciously. Slowly, then all at once.
This is the natural and frequently recurring capital cycle at work but in the market for investment dollars. The process follows the following sequence of events:
Investable assets with robust risk / reward profiles attract new dollars… which drives the price of those assets up… which leads to excessive profits for those early investors… which (in line with microeconomics 101) attracts new competition and fresh dollars… these new incremental dollars chase a relatively constant number of investable assets (supply is inelastic in the short run because development of truly unique things isn't easy)… this by definition shifts the risk / reward to one increasingly resembling returnless risk (as Howard Marks says, the only risk in an investment is the price paid).

The difference between typical capital cycles and full-blown asset bubbles is how aggressively and extensively the spread between the supply of dollars and the supply of assets is expanded. Now, given that exceptionally thoughtful and successful market participants like GMO founder Jeremy Grantham have said that 2021 was one of the four greatest asset bubbles in modern financial history alongside only the US in 1929, Japan in 1989, and US tech in 2001, it's important to understand why this occurred.
Every asset bubble in history occurs for the same fundamental reasons: 1) cheap money, 2) an urgency to deploy it, and 3) a lack of concern for risk. The first attribute increases the quantity of dollars relative to quality assets. The latter two increase the velocity of their exchange. There are many good resources on asset bubbles, manias, etc., but this summary of Booms and Busts is very concise and approachable:
The authors’ framework begins with a metaphor of bubbles as fires that grow based on a classic triangular combination of oxygen, fuel, and heat. With enough of each ingredient, a spark can set off a long-lasting market inferno.
Quinn and Turner’s analogue to oxygen is marketability, the ease of buying or selling an asset. Marketability includes divisibility, transferability, and the ability to find buyers and sellers at low cost. Assets that lack marketability will never see the broad demand required to create a bubble. Marketability is increased by improvements in market structure, low-cost exchange trading, and the introduction of derivatives.
A bubble’s fuel is easy money and credit. Without cheap and bountiful funds for investment, there is no opportunity for asset prices to be bid higher. Excessively low interest rates create demand for risky assets as investors reach for yield.
The final side of the triangle is heat generated by speculation. This is defined as purchasing an asset without regard to its quality or current valuation, solely out of belief that it can be sold in the future at a higher price.
For Quinn and Turner’s metaphor to work, the market’s catching fire, it must require a catalyst — the proverbial match. History shows that bubbles do not occur spontaneously. Rather, there is invariably some cause that creates a strong belief in the prospect of abnormal profits. In many cases, the catalyst is a technological change. Government policies and politics, however, frequently create a new environment that fosters a belief in the existence of unusually high return opportunities. The authors also discuss how the media can serve as an important driver of investment narrative and opinion that can fan the flames of a speculative fire. The financial press is not always a voice of reason; at times, it is an accelerant.
How does this apply to 2021? This Everything Bubble was steadily inflated by 14 years of unprecedentedly cheap money. For over a decade straight, the real effective interest was negative -- often deeply negative. This is seen in the chart below, which estimates the real effective rate by subtracting CPI (proxy for inflation) from the Atlanta Fed's estimated effective nominal rate (which adjusts the official Fed Funds Rate by the effects of quantitative easing).

What are interest rates, really? In a free market (i.e. one without the Fed manipulating things), they're the market clearing price of money. Said simply, it's the rate of compensation that people require to lend out their hard earned savings. Similarly, because money represents the commoditization of time (people convert hours worked into money), one can synonymously think of interest rates as the price of time. Said simply, it's a reflection of the price at which people will forgo current consumption for greater future consumption -- known as their time preference. I.e. it's the strength of demand for saving relative to borrowing.
And, ever since the GFC, the Fed has driven interest rates negative. What does that mean, really? The Fed artificially forcing interest rates negative encourages market participants to have a negative time preference -- i.e. to borrow more than they save. The policy has been highly effective. After all, for over 10 years, the market has paid people 1-10% annually to take on debt. Take a second to think about that. You go to the bank and apply to take out a $100 loan. Not only do they write you the check for $100, they say "we're so eager for you to take on debt that we'll give $4 on the house!" What a deal: getting paid money to borrow money.
The downside of being paid money to borrow money is that the scheme creates deeply perverse incentives. It facilitates A) the misallocation of capital to projects that wouldn't survive a positive cost of capital environment while simultaneously encouraging people to do something otherwise very irresponsible: B) take on leverage in order to speculate on financial assets. Indeed, when your cost of capital has averaged -2% for over a decade while returns on speculative assets have ballooned, you'd be crazy not to lever up that free arbitrage.
[note: to be clear, neither you, me nor any business can borrow at the Federal Funds Rate as its the overnight rate available for only banks with an account at the Fed. However, that rate sets the floor for every interest rate in the world. It acts as the universal force of gravity on all asset prices. So, it's the best way to talk about interest rates at large. It may not be exactly proper to say that everyone's been getting negative rates for years, but those negative rates flow through to every nook and cranny. And, a negative floor sets a pretty low standard for the world to be based on. No matter how one tries to approximate it, historically cheap money is historically cheap money.]
And, that's exactly what the market did.
- Capital was misallocated: as Stan Druckenmiller said in an interview, “corporate debt from 2010 to 2019 grew $4T or 65%. Meanwhile, the interest costs only went up 23%. Yet, over that time, corporate profits grew $400B or 29%. Think about how horrendous those returns on capital are. You grew debt 65% and somehow only had to pay 23% more for each dollar of debt. You'd think your profits would explode with that formula. Yet, corporate profits grew at 3% per year.”
- Companies took on leverage to speculate on financial assets: for decades, they borrowed the cheap money to speculate on their financial assets in the form of share buybacks, M&A, dividend payouts and other types of money shuffling at rates never seen. For example, see the total stock buybacks over time in the chart below.

According to Bridgewater's estimates, cheap money has accounted for roughly 40% of the cumulative gain in US equities over the last 20 years.

This estimate is backed up by the historic divergence between the performance of the real economy and that of the financial assets supposedly laying claim to the real economy:

Households did the same thing: for decades they have borrowed money to speculate on financial assets. As seen below, since 1985 (which is the last time interest rates offered a reasonable hurdle rate for investing in risk assets), households increased their debt / income by roughly 40% over those four decades while increasing their exposure to equities by roughly the same amount. I.e. they took on debt to buy equities.

All of this is to say that decades of stupendously easy monetary policy has lead both companies and households to take on debt to buy increasing amounts of risky assets. And to be clear, that’s not a condemnation of either companies or households. The monetary policy gave them no choice: you can’t possibly be expected to save money in safe assets when you’re guaranteed to lose money doing so. Either way, we have the cheap money and deteriorating risk aversion checked off from the recipe prescribed by Boom and Bust above. That combination had been built up for the last 40 years. Even before 2020, it had pushed people out the risk curve to the point where their risk appetite for equities was 2x as high as it was during the Nifty 50 bubble.
The responses of the Fed + Congress to COVID cranked the cheap money and risk tolerance up to manic levels. This manager puts it well: “QE Infinity turned your savings account into your checking account, the bond market into your savings account, the equity market into the bond market, the venture market into the equity market, while giving rise to the crypto market as the new venture market."
Most importantly for creating an asset bubble matched only a few times in history was the rapidity with which new dollars rolled off the printing presses and flooded the economy. One fifth of all the dollars created in the full 250-year history of America were printed in the last two years. And they rained down from the helicopters on anyone and everyone -- you didn't even have to be alive to qualify. That's a lot of cheap money sent out in a short amount of time.
The tsunami of new dollars flooded the real economy and the financial markets alike. Both the markets for financial assets and real economic goods / services have relatively inelastic supply in the short-term. While one can simply print more dollars, one cannot simply print more corporate earnings or Nissan Altima’s or apples. Thus, as discussed at the outset, you have an imbalance: too many dollars chasing too few goods. And, the mechanical result was a rapid rise in prices, or reciprocally, a rapid loss of purchasing power of those dollars that until recently had yet to be actualized.

As anticipated by the Boom and Bust model of bubbles, the fresh new dollars flowed particularly rapidly into the hot technologies of the moment that fostered a "strong belief in the prospect of abnormal profits." The dominant investor psychology was not the risk of principal loss but the risk of the price going up more. That's the exact dynamic of rampant inflation in any market, whether it's for bananas or biotech stocks: people spend their dollars as fast as they get them before the price goes up even more. Larger and larger rounds were raised at faster and faster rates. Some assets had price inflation akin to the hyperinflation of Argentina: 1,000%+ over time periods measured in months.

So, there you had it: 1) cheap money, 2) an urgency to deploy it, and 3) a lack of concern for risk.
A few months ago, the Fed was forced to recognize the secular inflation it had created throughout every market. As one of its two self-assigned jobs is to control inflation, it was forced to reverse course and bring in liquidity. Money supply growth plummeted as seen above, interest rates crept up, and fear spiked. The degree of financial speculation and leverage in all markets that had been built up over 40 years made a 75bps hike (one that sent real rates from -8% to -7%) made the Fed’s 180 feel closer to a Fast and Furious e-break U-turn that sent a bubble flying than an orderly stop at a red light. At that moment, the loss of purchasing power was actualized.
The framework below helps one understand the final leg of what happened once the Fed went from injecting trillions of dollars of liquidity to pulling it out at a similar rate:
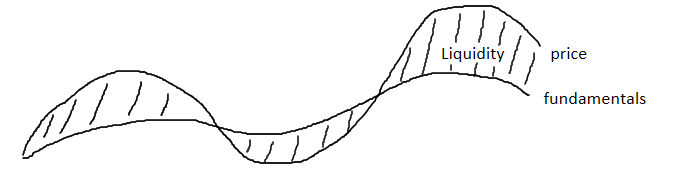
So, where does all this leave us?
Somewhere closer to the fundamentals.