Omics: Quantifying Cells' Attributes and Activity (The Century of Biology: Part I.II)
“The desirability of having much deeper knowledge about cells has been well recognized for a long time. However, only in the past few years has it begun to seem feasible to undertake the kind of systematic, high-resolution characterization of human cells necessary to create a systematic cell atlas. The key has been the recent ability to apply genomic profiling approaches to single cells. By ’genomic approaches’ we mean methods for large-scale profiling of the genome and its products, including DNA sequence, chromatin architecture, RNA transcripts, proteins, and metabolites.
It has long been appreciated that such methods provide rich and comprehensive descriptions of biological processes. Historically, however, they could only be applied to bulk tissue samples comprised of an ensemble of many cells, providing average genomic measures for a sample, but masking their differences across cells. The result is as unsatisfying as trying to understand New York, London or Mumbai based on the average properties of their inhabitants.”1
“After generations of crude stereotyping, biologists have come to terms with a simple fact: every cell has its own rich and complex inner life. And whereas past studies employed relatively broad terms to categorize cell types on the basis of their physical features or a handful of protein markers, today’s powerful technologies for ‘omic’ analysis have laid bare the limits of what can be understood at the bulk tissue scale.”2
Understanding human biology starts with our functional building block: the cell. Studying the mechanics of cellular function can be broken into the steps that information cascades through the body, starting from genetic code to molecular machinery. Transcriptomics studies the composition of cells’ RNA, the molecules that transcribe DNA and order the manufacturing of the specified proteins, to identify which genes are actually being expressed. Proteomics tracks what proteins, and how these machines are interacting with one another and other molecules within the cell. We study what these processes look like across healthy cells of all forms and compare that with diseased cells to try to tease apart the mechanics of disease.
The tools, technologies, and methods necessary to quantify every one of these aspects with both high fidelity and high throughput have been revolutionized over the last couple decades, many outpacing Moore’s Law.
For each technique, I provide a basic summary, what it’s used for, examples of biomedical advances it contributed to, and data on improvements in cost, speed, accuracy as well as usage where the data’s available.
- Transcriptomics: Quantifying Which Genes are Active
Transcriptomics sequences the mRNA of cell(s) to understand what genes are being expressed. It rose contiguously with NGS. The two broad types are bulk cell and single cell RNA sequencing (scRNA-seq). The former types a chunk of cells, splits them open, and gets to sequencing. It thereby quantifies an average genes expression of a population of cells. It’s useful to measure gene expression differences between tissue samples (whether that’s from different parts of the body or the same tissue over time). It's far cheaper and requires less technical skill to perform the experiment and evaluate the data. If, however, teasing out cell heterogeneity and its impact on cell function is important to the study, then scRNA-seq is essential.
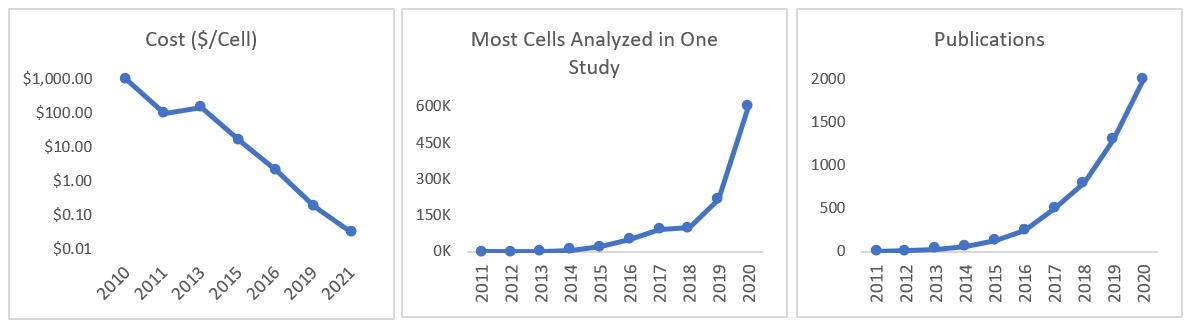
Scientists reported the first genome-wide scRNA-seq in 2009. Since then, the field has improved exponentially in terms of cost, throughput, and accuracy. Commercial hardware now enables routine analysis of 20,000-plus cells in a 7-minute instrument run and millions of cells in single studies.1 There’s hundreds of methods and 1,600 data analysis tools. A sample of the differences between the most popular approaches can be seen below. The ideal approach depends on a scientist’s data set and research questions. SmartSeq2 is the most accurate and precise, identifying the most genes per cell but is expensive and lower throughput. 10X Genomics’ Chromium system is the most widely useful as it checks every box quite well. These systems partition cells from samples using technologies like microfluidics that suspends cells in micro sized droplets of liquid or FACS that uses lasers to bounce cells into individual containers based upon the specific light scattering and fluorescent characteristics of each cell.[1]

All this work developing new instruments and methodologies means that the cost per cell fell by 100,000x in 10 years and the throughput by several-million-fold, as seen in the graph below.1
In addition to examining the complete RNA landscape at a given point in time, we can now also do things like record the order in which genes are turned on, logging genetic activity for days at a time, and or measure the age of RNA by attaching an engineered RNA-editing enzyme as a temporal barcode to each RNA. Tracking the ages of RNA populations from a single cell helps us “infer the multiplicity, timing, duration, and magnitude of transcriptional events.”
Here are some examples of how RNA-seq technology has been used:
- Spatial Transcriptomics: Adding the x- and y-axis
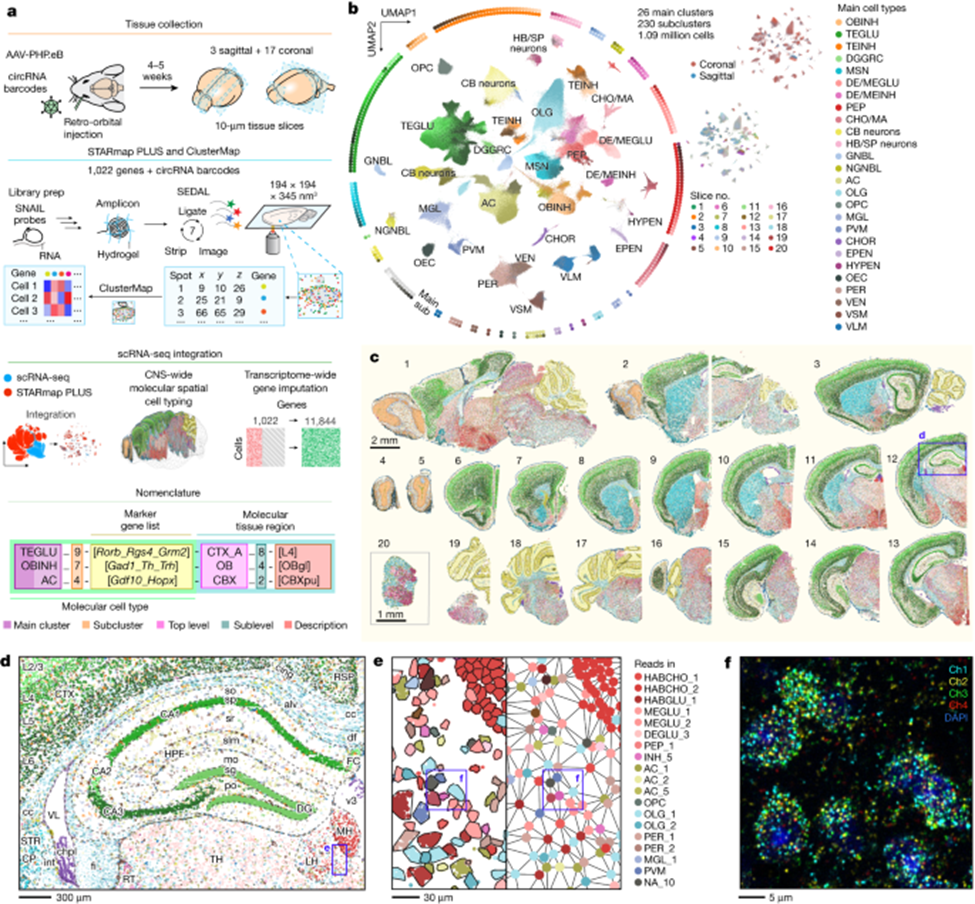
Three years after scRNA-seq won Nature’s 2013 Method of the Year, its successor was invented: spatial transcriptomics. And, four years later, it won the same honor unanimously. This method adds GPS coordinates to the transcriptional data, specifying which gene got activated on what cross-streets within a map of an individual cell. To elucidate the combined scale and specificity new techniques can map out tissues, this recent publishing maps out in 3D the transcriptome of the entire mouse brain and spinal cord – 1,000 genes and 1M+ cells in total. Behold its exquisite beauty; notice that exhibits c to f zoom progressively deeper into the brain, magnifying the original image half-a-million times to reach the scale of billionths of a meter, all without losing much in resolution.
Or how ‘bout this snapshot of a retina at work:
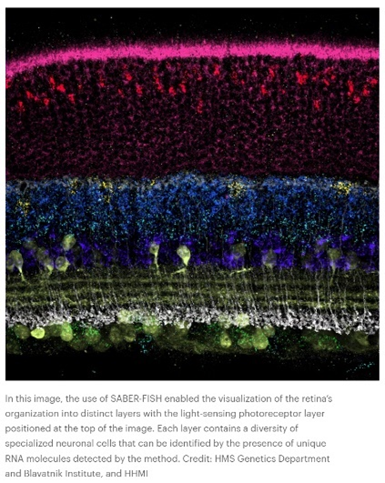
Such data is collected in broadly two ways: via imaging the cell as is with advanced microscopes techniques or with ex situ scRNA-seq methods that retain spatial information. In the former, “transcriptomes can be read out by microscopy through in situ sequencing or multiplexed fluorescence in situ hybridization (FISH).” In the latter, “cellular RNAs are barcoded in a grid-like fashion on the basis of their position in a tissue slice before homogenization and scRNA-seq. These methods offer unbiased capture of the transcriptomic landscape with relative high throughput, but do not yet offer subcellular resolution. These approaches are often complementary and differ in their target coverage, spatial resolution and throughput; like all methods, they must be appropriately matched to their biological questions.” This article and this one describe how the respective methods work in detail.
These new techniques have rapidly been standardized into systematic commercial products, like this error-resistant MERFISH instrument that detects RNA transcripts from hundreds of genes across intact tissue and returns imaging and expression data. But, machines like that can cost about $300,000 each, prohibitively expensive for many labs. So, the Broad Institute came up with a cheaper DIY version called "Slide-seq.” “The technique uses a layer of tiny beads, coated with pieces of barcoded DNA, on a slide to help mark the positions of mRNA from thousands of genes. Version 2.0, which crams much more DNA onto each bead and can put up to 1 million beads on a slide, makes the gene-activity mapping more precise by an order of magnitude. Moreover, the entire protocol is public. "It really empowers other labs to do it. The technique is easy to apply. You don't need any special instruments compared to other methods."
Researchers have also devised a brand new method that can continuously track thousands of mRNAs simultaneously over both space and time:
In recent years, scientists have devised methods that can take snapshots of mRNAs scattered across a cell and measure the ebb and flow of their abundance, but they haven’t yet been able to track the individual movements of a large number of them over time.
A new method built by scientists at the Broad Institute of MIT and Harvard is the first large-scale approach to track mRNAs over both space and time in individual cells. Known as TEMPOmap (temporally resolved in situ sequencing and mapping), the method simultaneously measures the subcellular movements of many RNA molecules, with the potential to follow a molecule from its birth through to its death.
TEMPOmap chemically labels newly made RNA molecules and uses a unique approach to sequence them at specific locations in the cell at several time points, allowing researchers to track thousands of RNA molecules in parallel over time. In a study in Nature Methods, the research team described TEMPOmap and how it enabled them to follow mRNAs in a variety of cell types, measure the speed at which the molecules were transcribed from DNA and move within the cell, and discover surprising movements of the RNAs in the cells.
Here’s a good example of how spatial transcriptomics is being used:
Simultaneously mapping gene expression and location as well as spatial distribution of specific proteins in intact tissue samples to study Alzheimer's: observed a central core of amyloid plaque surrounded by a type of immune cell in the brain called microglia.
A common sign of Alzheimer’s disease is the excessive buildup of two types of protein in the brain: tangles of tau proteins that accumulate inside cells, and amyloid-β proteins that form plaques outside the cells. Researchers don’t know how these protein deposits are related to the other major hallmark of the disease: the death of neurons in the brain.
A study by scientists at the Broad Institute of MIT and Harvard published today in Nature Neuroscience hints at some answers to this question. The team used a new method they developed to reveal how brain cells located near these proteins change as the disease progresses in a mouse model of Alzheimer’s. The technique, called STARmap PLUS, is the first to simultaneously map gene expression of individual cells and their location, as well as the spatial distribution of specific proteins in intact tissue samples.
The researchers used their approach to study brain tissue from the Alzheimer’s mouse model at two different stages of the disease and at high spatial resolution. In the earlier stage, they observed a central core of amyloid plaque surrounded by a type of immune cell in the brain called microglia, which are known to play a role in Alzheimer’s. The microglia that were closer to the plaques showed genetic signatures that have been linked to neurodegeneration.
The scientists also found outer shells of two other types of brain cells that emerged later in the disease. This core-shell structure and differences in gene expression of cells surrounding the proteins give scientists a clearer picture of how cells respond to the protein deposits in the brain — insights that could one day help scientists evaluate existing Alzheimer’s treatments and develop new ones.
“This is an exciting improvement on STARmap because we can now co-map the entire transcriptome together with proteins in the same tissue slices, and many diseases involve changes in protein localization and post-transcriptional modifications,” said Wang.
And another one:
For decades we knew that cancer tissue was heterogeneous, with some cells exhibiting more aggressive growth and spread features than others, but we didn't have the tools to understand it. Now we do, and it’s well beyond understanding the spatiotemporal evolution of cancer—it’s being applied across the board from Alzheimer’s disease, atherosclerotic plaque, the retina, pancreatic B-islets, spinal cord to whole organ characterization such as heart, kidney, lung, intestine, and maternal-fetal interface. Much of this work is part of the Human BioMolecular Atlas Program (HuBMAP), now in its production phase involving 60 institutions, over 400 investigators, to generate high-resolution 3D accessible maps for > 20 organs. You can think of it as generating the Google Map for the entire healthy adult human body at the single-cell level. And it’s quickly becoming a reference, anchor resource for diseased cells and tissue.
Both commercial and academic labs are “racing to improve spatial transcriptomics and to extend cell-by-cell mapping to other key indicators.” For imaging-based techniques, higher resolution, large-field-of-view microscopes will increase throughput without sacrificing specificity. And, continued improved in sample preparation like tissue clearing and expansion microscopy will help address issues like autofluorescence and crowding. Ex situ sequencing-based approaches will be driven by, unsurprisingly, improvements in sequencing technology sensitivity and coverage. It’ll also be propelled by advances in barcoding platforms (e.g. microbeads and microfluidics) and strategies, leading to improved data quality and subcellular resolution.
Good reviews of spatial transcriptomics for more detail: 1,2,3
Proteomics: Measuring Microscopic Machinery
Identifying an object a handful of nanometers wide presents a great challenge. Its difficulty is compounded by the fact that it’s not easily amendable to NGS, for reasons described below. Hence, protein characterization is still more of an ongoing basic science problem than the technologies detailed above. There are several broad kinds of analysis: identifying individual proteins in a mixture, mapping proteins in a cell, tracking them over time, etc. with sophisticated techniques for each.
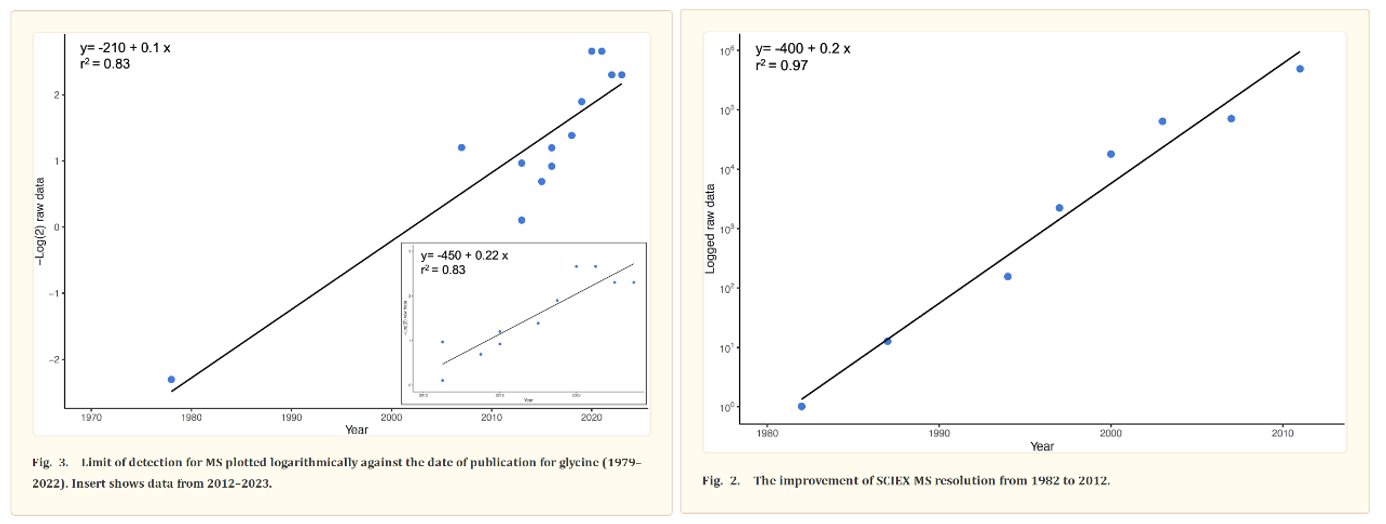
The most common way to identify proteins in mixtures is called tandem mass spectrometry (MS/MS). In MS/MS, proteins are first digested into peptides using enzymes like trypsin. The resulting peptides are then analyzed in the mass spectrometer. The instrument measures the ratio of the peptides’ mass to its charge (m/z) and then fragments them to obtain their amino acid sequence. The precision of these machines has been improving at around the pace of Moore’s Law for over forty years, as detailed by this review. Protein identification is achieved by matching the observed peptide mass and fragmentation pattern to a database of known protein sequences.
Despite the progress made, more is needed because of how subtle the interactions between amino acid sequence, protein shape, and protein modifications are:
George Church postulated that the unexpectedly low number of genes in humans is necessitated by the need to have a useful immune system.142 If the sequence space of humans were too large, pathogens could readily evade the immune system. Functional diversity must then result from small changes in proteins rather than from completely new sequences. Alternate splicing and covalent modification create this functional diversity. To fully understand human biology, we must begin to understand the functional roles of protein isoforms and modifications and thus we need technology to readily separate and measure protein isoforms and modifications in a functional context. As we've learned with histones and their complex sets of modifications, patterns of a modification or patterns of different types of modifications together may create a higher order of regulation.143
To fill this need, robust methods to measure molecular weight and determine sequence for intact proteins would be ideal. Technology for “top down” mass spectrometry is still developing and will require significant innovation to reduce the cost and complexity of mass spectrometers to democratize its use.144-147 In the intermediate term, MS analyzers to sequence and characterize longer polypeptides in the range of 5-10,000 Da have improved dramatically in the last few years, but proteases or chemical cleavage methods to cleave proteins in to 5-10K pieces are needed. Most proteases produce smaller peptides, although Wu et al recently reported a bacterial protease, OmpT, that is a rare cutter protease producing on average polypeptides 6.3 kDa or greater.147 Higher resolution mass spectrometers coupled with ETD should permit ready characterization of these medium sized polypeptides. 146 (Source)
Independent of the needs for research like George’s, a company formed in 2018 from research born out of an Oxford lab to commercial a new technology, called mass photometry, that measures the weight of single molecules by the way they scatter light. The approach meant that molecules didn’t need to be transferred to vacuums as in MS but could stay in their buffer solutions. It cuts down the time to understand exactly what’s in a solution.
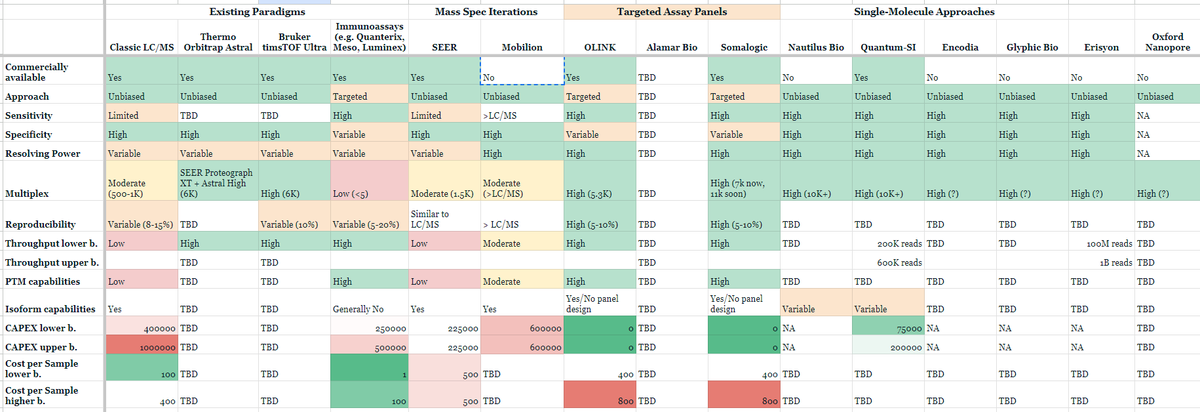
Other companies like Nautilus, Glyphic, Portal, Parallel Squared, Olink, and Quantum Si are pioneering efforts to make large scale proteomics as accessible as that of NGS DNA sequencing. Indeed, there's now many next-gen proteomics approaches and platforms:
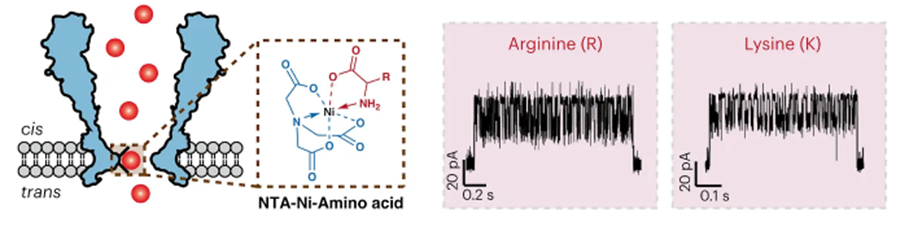
Possibly the most promising attempt yet to bring the combined throughput and reliable accuracy of nucleotide sequencing to proteins was put forth just weeks ago in a proof-of-concept demonstration. The group developed a nanopore-based technique to identify proteins. All 20 amino acids and some post-translational modifications (PTMs) could be discriminated through a nanopore engineered with a nickel ion on the inside of the channel (image below, left). As each amino acid passes through the channel, it changes the potential of a voltage applied across the membrane (image below, right). A machine learning model was trained on the current traces and achieved 98.6% accuracy in classifying amino acids.
Whereas MS is a reasonably mature technology capable of identifying a protein in a vacuum (literally) with high accuracy, our ability to measure and understand a cell’s complete collection of proteins as they exist in their natural habitat is still very much an unsolved problem in basic science. NGS has yet to revolutionize the field the way that it did with transcriptomics because proteins are far more difficult to sequence than RNA or DNA for various reasons. The greater chemical complexity of proteins, composed of 20 different amino acids, contrasts with the simplicity of DNA and RNA, which comprise four nucleotide bases. Breaking down proteins into their constituent amino acids involves covalent peptide bonds and proteolytic cleavage, while DNA and RNA sequencing follows relatively straightforward enzymatic processes. The genetic code's degeneracy adds complexity to deciphering the exact protein sequence from DNA, and protein post-translational modifications further complicate the matter. Complex three-dimensional protein structures, sequence repeats, and protein degradation risks make protein sequencing a multifaceted endeavor that often requires a combination of specialized techniques for accuracy, including mass spectrometry, X-ray crystallography, and NMR spectroscopy, setting it apart from the relative simplicity of DNA and RNA sequencing.
Because of this difficulty, researchers often default to RNA sequencing as a surrogate for proteome-wide profiling. The count of a given mRNA is a solid proxy for protein expression because its frequency is generally roughly proportional to that of the particular protein it codes for. However, it’s far from perfect, since not every RNA is not translated into a protein. Moreover, “a long-lasting mRNA may be translated into protein over and over, for instance, leading to much higher levels of a protein compared to translation from a short-lived mRNA molecule. Cells also regulate rates of translation — cancer cells, for example, often turn up translation, producing more proteins than healthy cells even when they have similar levels of mRNA.”1 This imprecision allows for a potentially misguided snapshot of cellular and biological function.
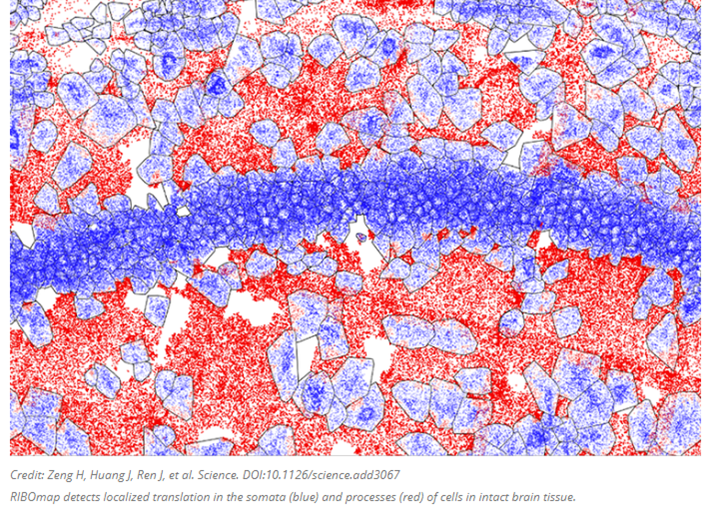
Several groups are cataloguing the proteome by combining our comfort with RNA sequencing with a method more directly coupled with protein expression: by keeping track of when and where each protein is as it’s translated from the RNA by the ribosome. Translatomics, as the field is called, focuses on RNA fragments bound to and protected by ribosomes, presenting a window into the transcripts as they are actively being translated to proteins. Researchers at the MIT and the Broad Institute developed a new technique this year called RIBOmap that pinpoints and visualizes the exact location of thousands of proteins as they’re created within intact tissue and even individual cells. Each dot in the image below represents an mRNA as its corresponding protein rolls off the assembly line.
The method, described today in Science, provides a way for scientists to learn new details on how translation is regulated within individual cell types and how that changes in disease. In the paper, the team used RIBOmap to study the translation of more than 5,000 genes in mouse brain tissue.
RIBOmap, like its predecessor STARmap designed for spatial transcriptomics, uses molecular probes that bind to specific mRNA sequences in tissue and single cells. Each probe contains a unique barcode, allowing the researchers to identify each mRNA molecule. And by using a confocal microscope to analyze fluorescent signals generated by in situ sequencing reactions in the tissue sample, the team could map the location of each mRNA. While the STARmap probes can light up any mRNA molecule, the RIBOmap probes only attach to mRNA molecules that are also bound to ribosomes — the cellular machines that carry out translation.
In the future, the researchers imagine using RIBOmap to compare healthy and diseased tissue or see how drugs impact protein production within different cell types or areas of a tissue. They also plan to use the technology to investigate the basic mechanisms cells use to tune levels of translation.
A similar technique is being used by a company spun out of one of the world’s top biotech incubators, Flagship Pioneering, to expand our understanding of which genes code for which proteins. Flagship explains the issue being addressed as follows:
Although only 2% of the genome was originally annotated as protein-coding, it turns out that much of the remaining genomic DNA gives rise to RNA, the intermediary between DNA and proteins, but the function of these transcripts have since been proposed as regulatory or simply junk. The field has now established that upward of 80% of human genomic DNA is transcribed into RNA that does not arise from the original annotated genes, including classes such as long non-coding RNA (greater than 200 nucleotides long). (Source)
Other brand new methods have attempted to profile the proteome directly. One group of Stanford researchers just released a new method called TransitID that unbiasedly tracks the activity of all proteins in a living cell as they go about their day. It’s even able to follow proteins that move between cells. Existing technologies like MS and microscopy can either only observe a handful of proteins at a time in a live cell, or produce a detailed still frame of a dead cell. Tracking proteins at this level of detail and liveliness could “unveil untold information about how cells communicate. In addition, there are obvious applications for research into various diseases and treatments, including in the realms of cancer and neurodegenerative diseases.”
In very simple terms, TransitID tracks all the proteins along a specific journey by tagging all the molecules within a certain radius of chosen beginning and end locations. First, two enzymes developed previously by the Ting lab, called TurboID and APEX, are placed at each end of the journey. When the researchers are ready to begin their protein monitoring, they introduce the B vitamin biotin, which causes TurboID to spray biotin on all the surrounding molecules – including proteins – tagging them. The researchers then wash the cell of excess biotin and allow it to go about its usual activity. When they think the proteins have had enough time to travel, they then add the chemical compound alkyne-phenol, which causes the same spraying action on the APEX end.
The researchers interpret the individual excursions of the proteins that moved between the tagged locations by breaking down the cell membrane and analyzing the contents. Some proteins will never have moved, either having only TurboID tags or only APEX tags. Those that have both, made the journey between. And anything without a tag resided beyond the journey of interest.
“I’m excited about the simplicity of the method and how accessible it is, given what’s already out there,” said Ting. “It uses commercially available reagents and people don’t have to do any organic chemistry in their own labs to use the method, and yet they can access totally new biology that wasn’t visible before.”
The team still sees room for improvement, specifically aiming to optimize their process and rely on less toxic chemicals. For now, TransitID is limited to being used in cell cultures but, with gentler chemicals, it could be used to track detailed protein dynamics in living animals. For example, Ting and colleagues at the Wu Tsai Neurosciences Institute at Stanford hope to use future versions of the technique to study protein signaling between different cell types in the mammalian brain.
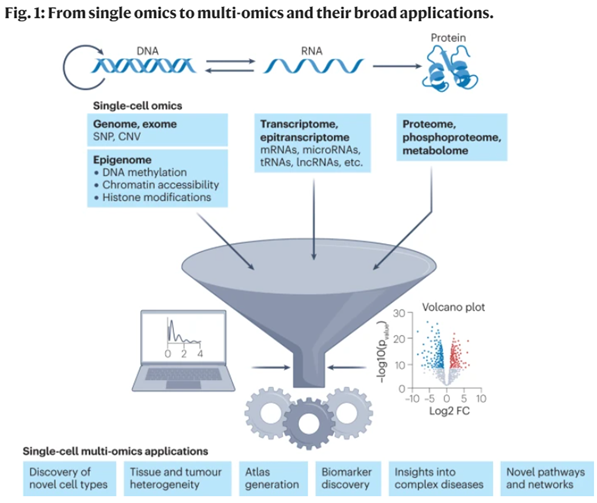
- Multi-omics: Measuring Multiple Attributes Simultaneously
Here’s where it all comes together, pun intended. As researchers dissecting the transcriptomic heterogeneity of single cells and uncovered entirely new cell types or identities, they increasingly realized that combining scRNA-seq with other types of data points provides information that’s more than the sum of the parts. Researchers have devised methods to explore all the possible combinations of 2-3 omics data points at the same time. Per Robert Stickels of Broad Institute’s genomics department, "Soon there will be technologies that give you more and more types of data all together at the same time, spatial information, RNA, DNA, chromatin, protein, temporal information about cellular histories, metabolite profiling, you name it, at single-cell resolution."1
Remind yourself that all these technologies were invented within the last 20 years, some within the last ten years, and have all been improving at exponential rates, many outpacing Moore’s Law. As each modality continues its respective revolution, Stickers’ dream will ultimately be realized, where all kinds of data are collected from a single experiment at subcellular resolution across countless cells simultaneously.
For more detail on the value of multiomic analysis, read the excerpt below:1
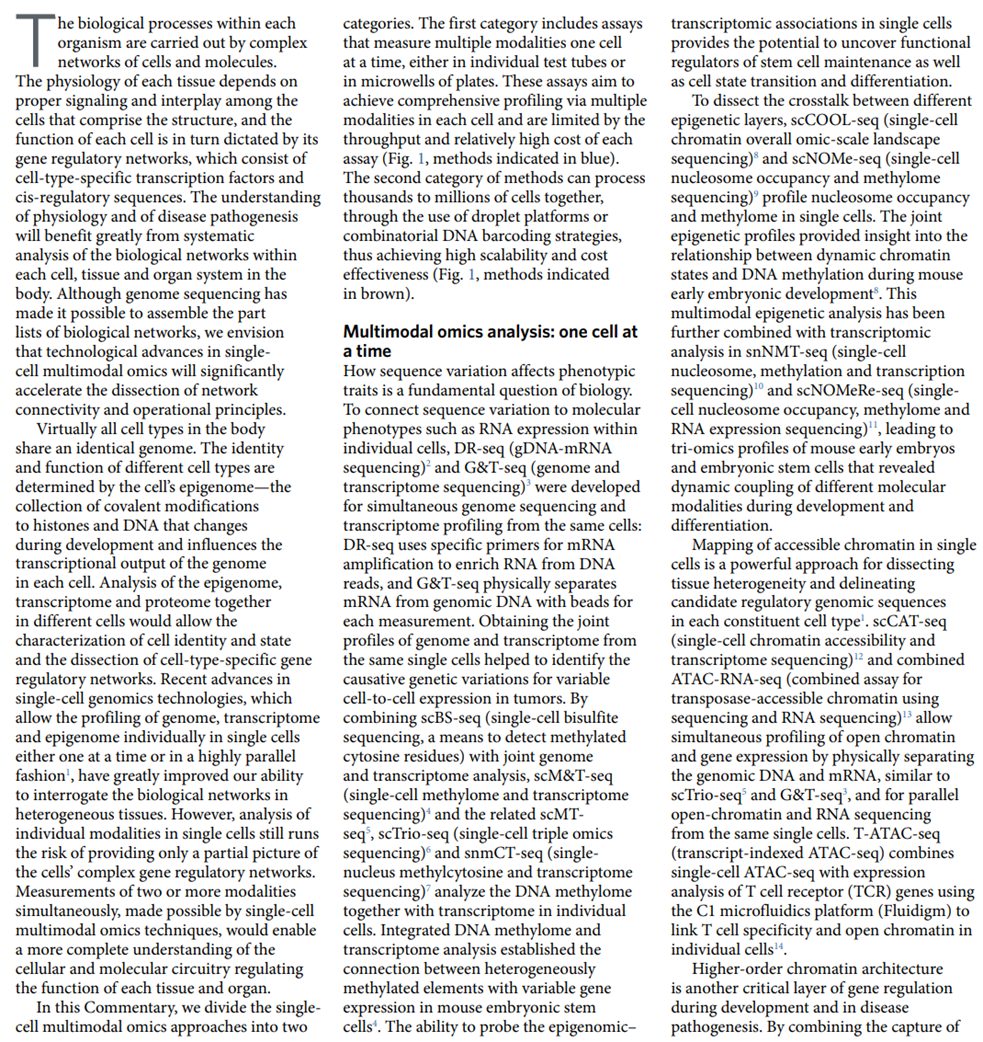
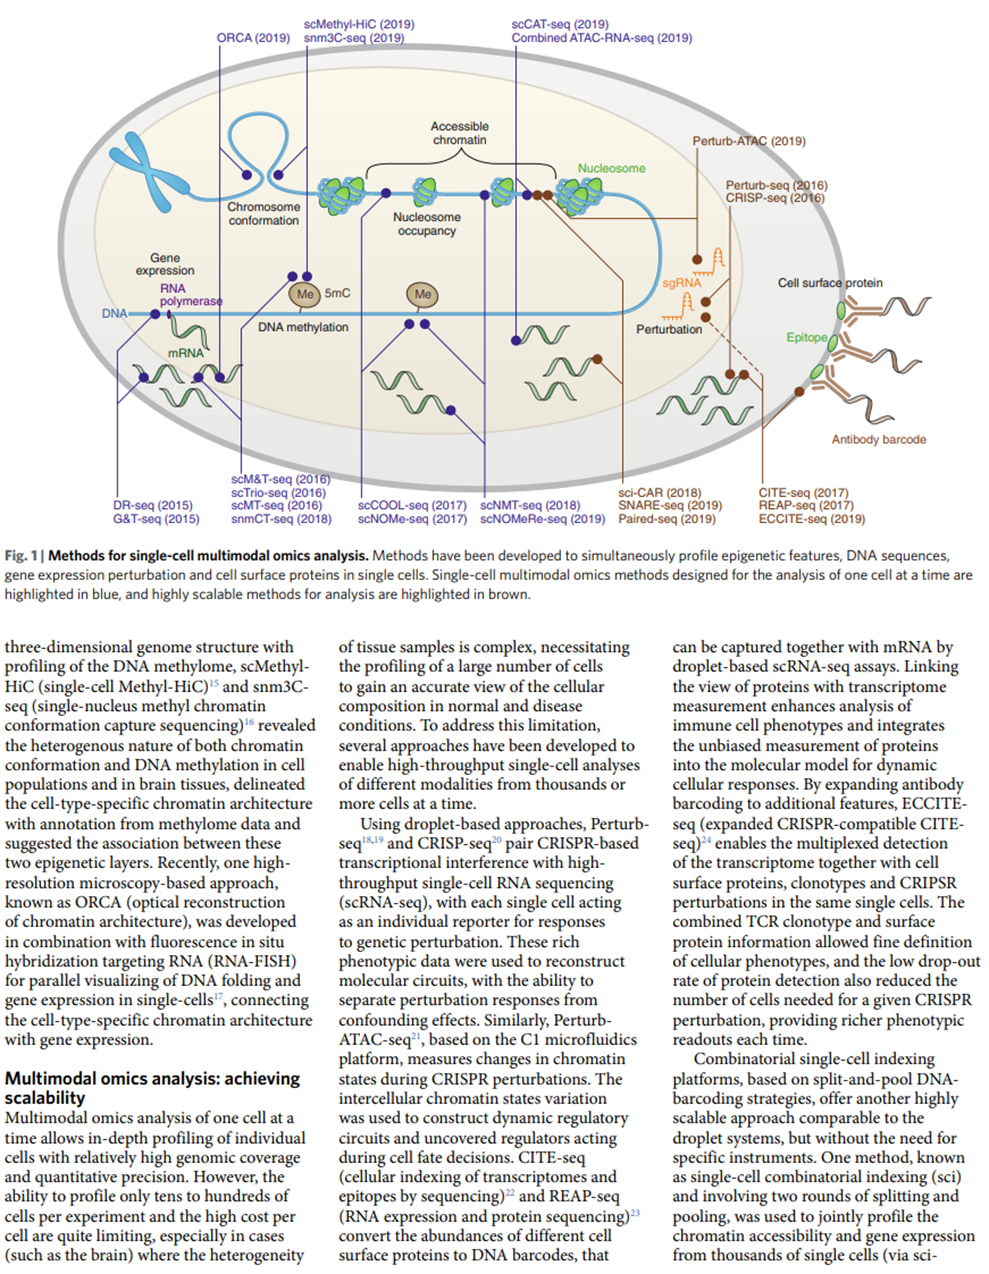
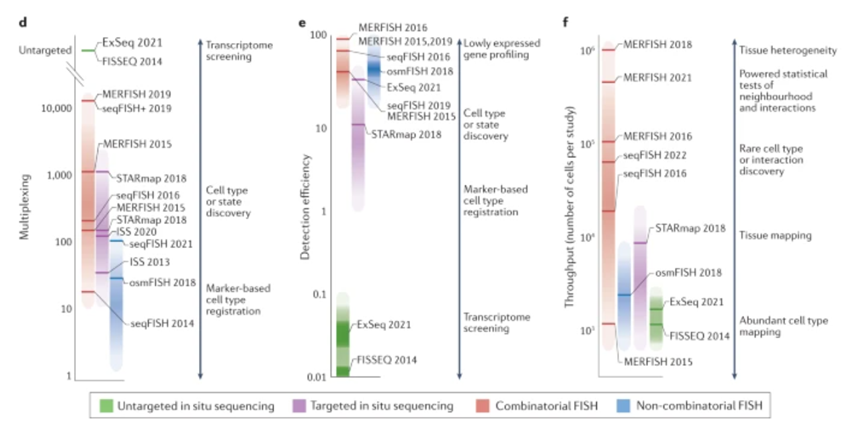
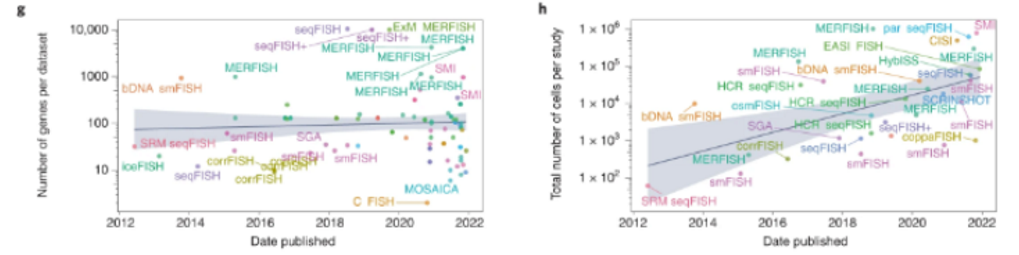
Here’s a visualization of the breadth of methodologies available:
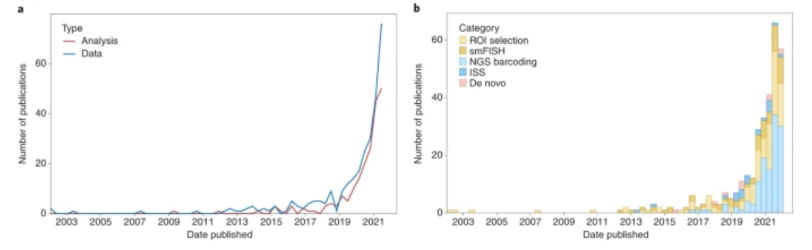
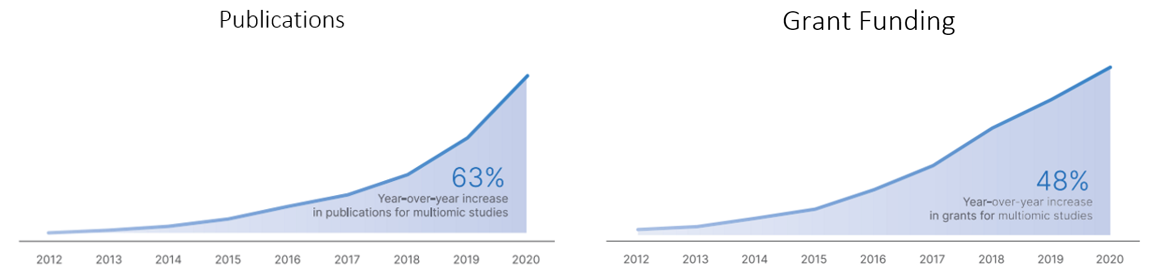
The publications of and grant funding for multiomic research has tracked its progress:
See these journal reviews1,2,3,4 for more detail on multiomics.
Read next section: visualizing biology with microscopy
[1] See these1,2,3,4 studies for more detail on how the RNA-seq works under the hood. See these15,16,17,18,19 citations for detail on how individual scRNA-seq methodologies differ.